Realtime Analytics
Home ► Quick Access ► Realtime Analytics ► Content Types ► Table Layouts
Creating a Table Layout
Introduction
Omni Intelligence (OI) has introduced a new Analytics view – the Table Layout. It enables multiple fields for multiple queues to be displayed in the one “field” of OI Analytics.
Instructions
Like the other fields available in Analytics, selecting “Content Type: Table” will enable different configuration options to appear on screen.
Caption:
This is a label to be displayed on the OI display.
Metrics:
These represent the field you wish to report on.
Queues:
These represent the queue to report on.
Result Queue:
This is the queue that gets presented in the TOTAL row. It doesn’t actually need to be “the subtotal of the other queues”. If you wish to actually display the total values, then you would need to create a “Consolidated Queue” first, and then select it as the “TOTAL row”.
With reference to the screen capture below;
--No Total queue-- – doesn’t display a total line.
Sales – East – selecting these would display the respective queue values “in the total” row.
Sales – West – selecting these would display the respective queue values “in the total” row.
Sales – Central – selecting these would display the respective queue values “in the total” row.
Queue Consolidation – this was a “Consolidated queue” set up previously (with the name “Consolidated Queue” (a bad example name in this case).
Further information on consolidating queues can be found here.
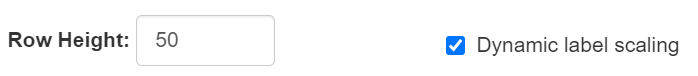
Font Size:
What size the Label should display with.
Dynamic Label Scaling:
Choosing this option changes “Font Size” to “Row Height”.
Column Presentation Format
These settings enable you to change the order in which the data is presented. You can also rename the column by changing the “Column name” field.
The “Default” dropdown
Clicking the dropdown labelled “Default” will produce.
These settings enable you to modify the formatting of the data being displayed.
For example, possible “timespan” formats include:
Thresholds
Thresholds are applied like the other sections of OI.
Selecting “Range” or “Not in Range” enables you to enter two values (the bounds of the range).
How the Table Data Gets Presented
The fields (per queue) go across the page, and the different queues are displayed vertically.
Example Layouts
For ease of display, these are very limited examples of potential table layouts.
2 Queues, 2 fields = 1 Total Line.
The configuration for the above:
Related
Queues Consolidation
OI can consolidate queues together to provide a subtotalling effect. These new consolidated queues then can be reported on like normal queues. For further information, click here.